

Open the Metrics tab
You can open the same charts from two places.- Open Integrations, select the Connected tab, and select your gateway. Then select the Metrics tab next to the connection tabs.
- Open Cost breakdown and group by Provider. Select your gateway’s row to open its provider page, then select the Metrics tab.
Chart controls
The menus at the top of the tab change what every chart shows.
Each chart draws one line per model. A model keeps the same color in every chart.
Model names appear as the gateway reports them. Select the refresh button on a
chart to load the latest data.
The following screenshot shows the charts for an agentgateway connection that
serves two models.
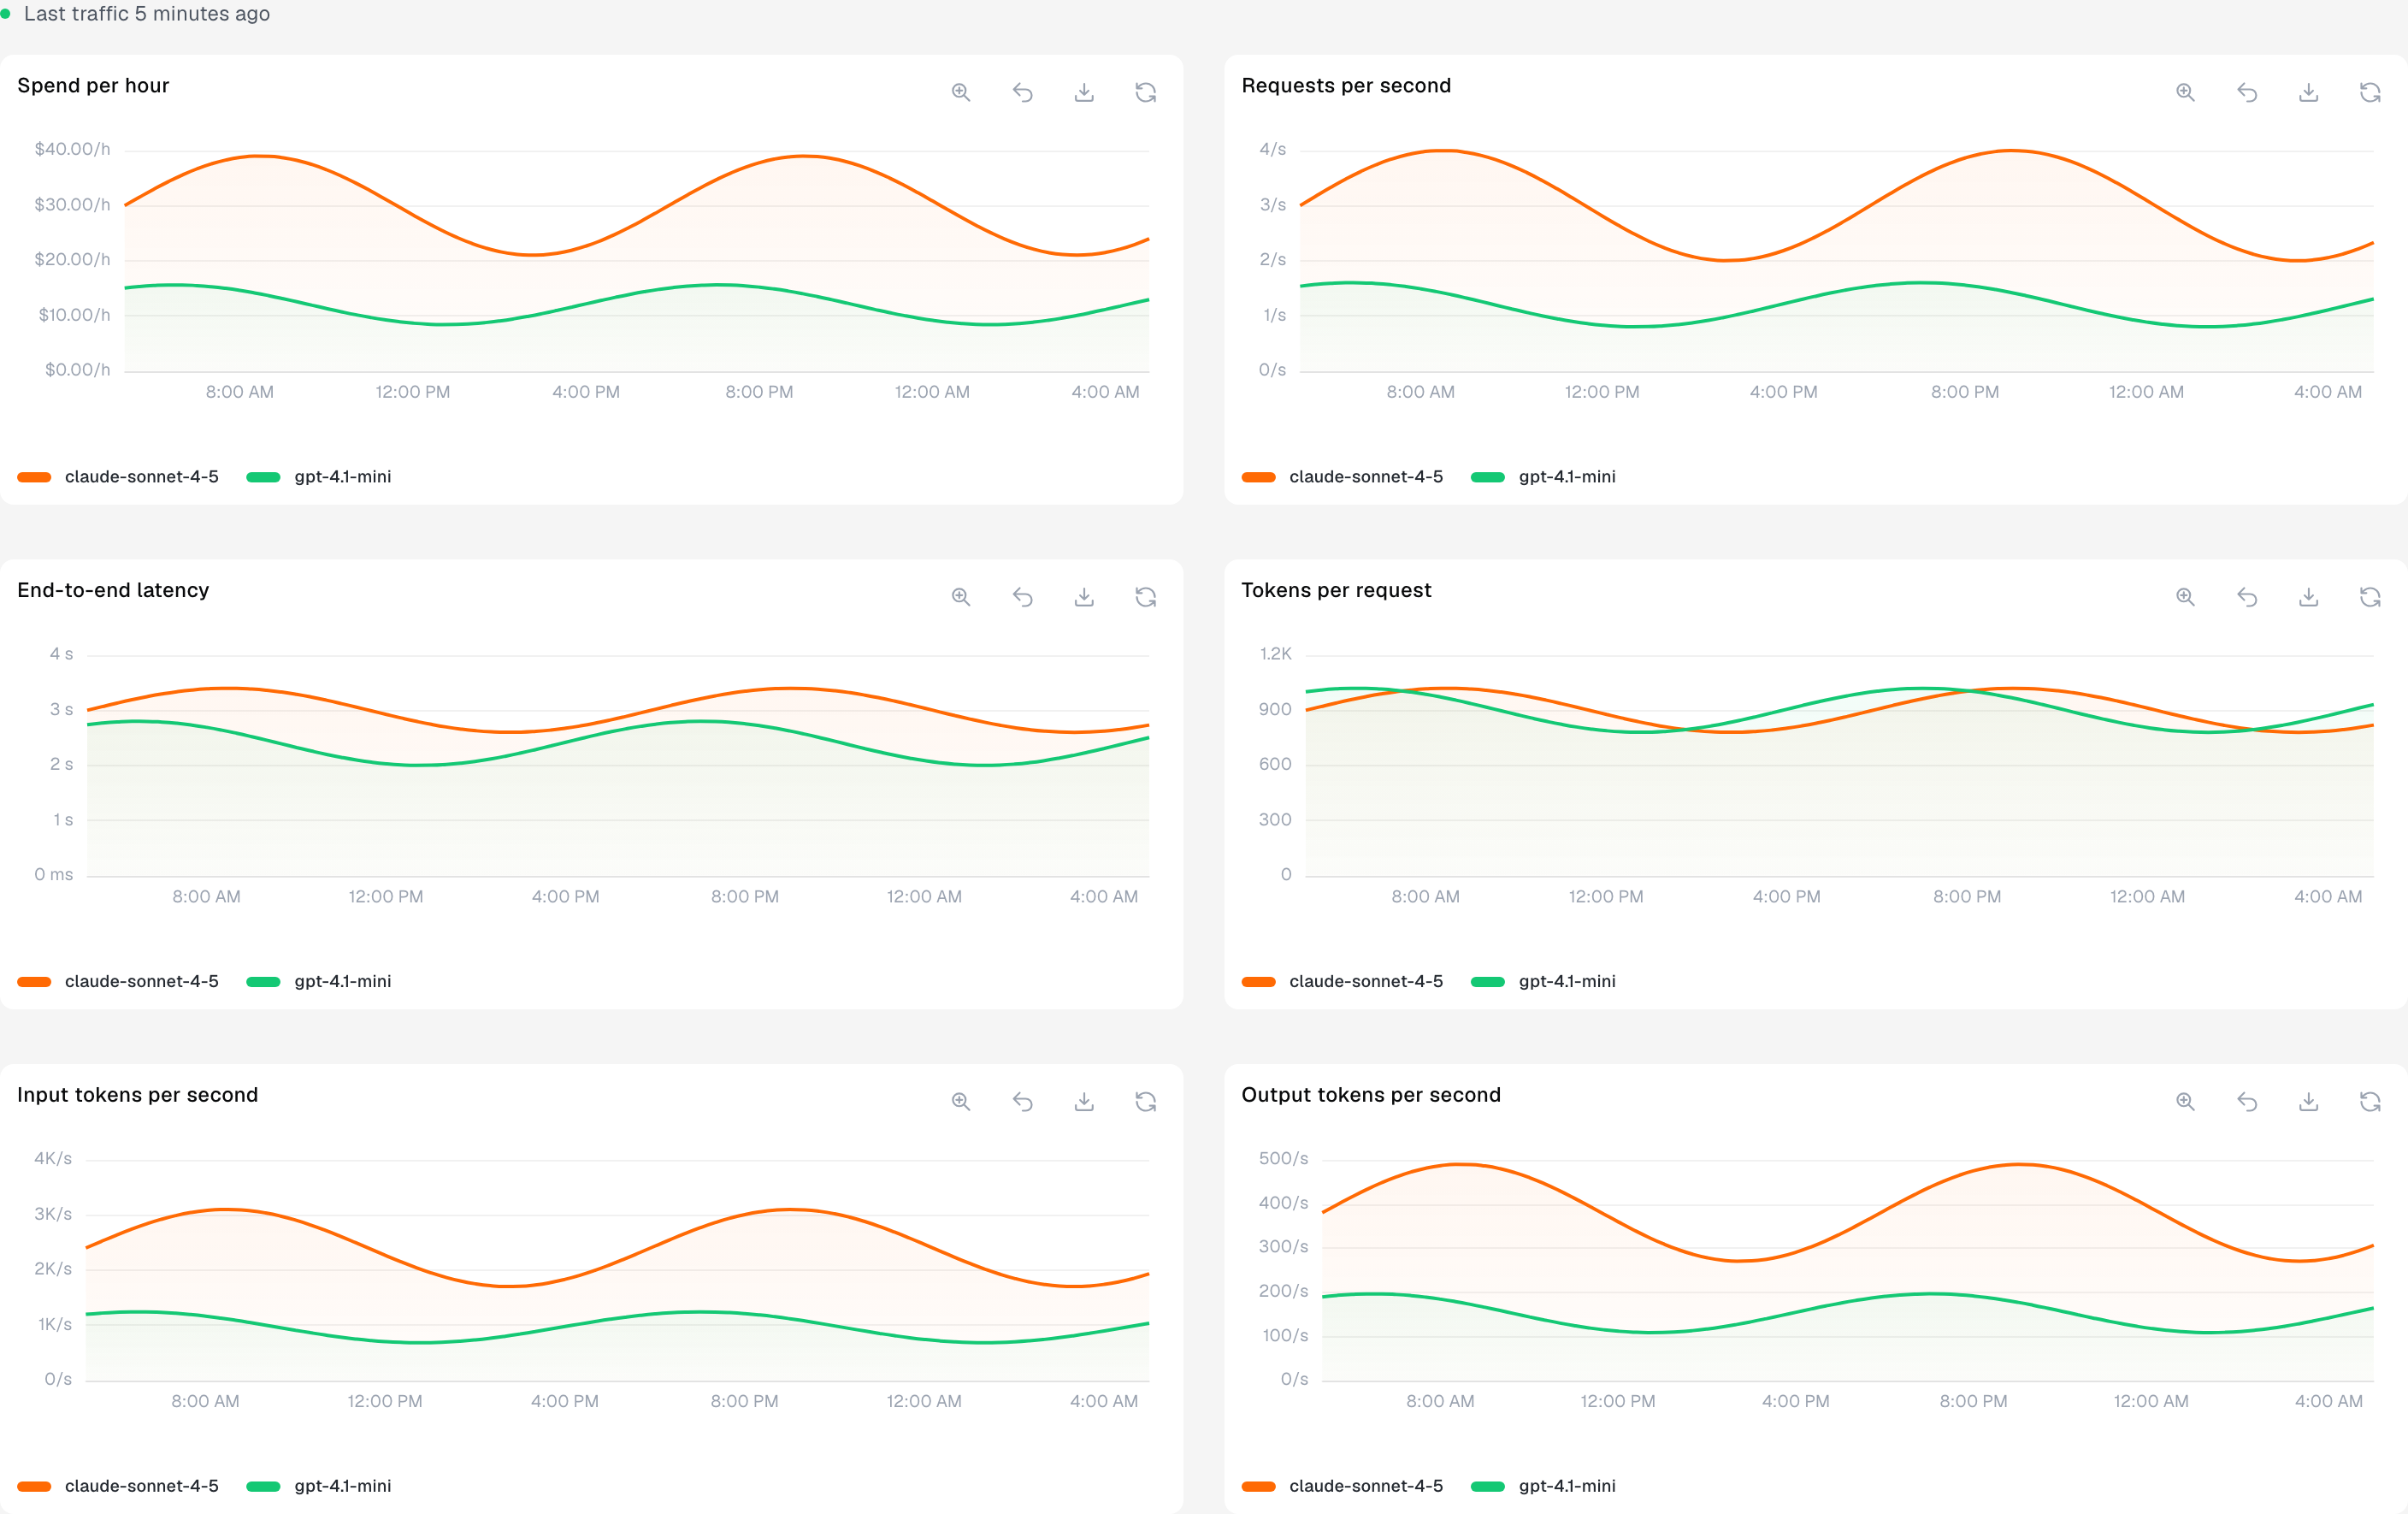
Gateway metrics for two models using sample data. Select the image to view it at full size.
Gateway charts
The tab shows the following charts.
The line next to the menus reports the most recent traffic, such as
Last traffic 5 minutes ago, or No traffic in this range. Its dot turns
amber when the gateway reported no tokens in the last 30 minutes of the range.
The tab then shows a warning with the time of the last traffic and a
Check the connection link.
A model without a rate has no Spend per hour line. The tab names those models
in a note at the top of the tab and counts no cost for their tokens, the same as the
bill. To price them, see Model map
and Use your own model rates.
Metrics by gateway
Every supported gateway reports token usage, so the token and spend charts work for all of them. The request, latency, and tokens per request charts need the gateway to report request duration.
For a gateway that does not report a measurement, the chart says so instead of
showing zero. For example, an Apache APISIX connection shows
This gateway is not reporting request latency. on the latency chart.
Connection alerts
CostGraph alerts you when a gateway connection stops delivering data. The alert appears in several places.- A banner at the top of every dashboard page names the connection, or counts the affected connections, with a link to them. Select the close button to hide it until the alerts change or you sign in again. The banner does not appear on the Integrations pages, which show each alert in full.
- A dot marks Integrations in the sidebar. Hover over it to list each connection that needs attention.
- A red badge marks the gateway in Integrations > Connected.
- The gateway’s integration page and provider page show a banner for each affected connection.
For a gateway that has not delivered data, the banner lists the two usual causes.
Either the gateway has not served a model request yet, or the collector cannot
reach it. Gateways publish token and latency metrics only after they serve a
request to a model.
The following screenshot shows the banner for a connection that has delivered no
data since it was created.

A connection alert using sample data. Select the image to view it at full size.
Empty charts
An empty chart means CostGraph received no data for that measurement in the selected range. Check the following before you change the connection.- Widen the time range. A gateway that served no requests in the last hour has nothing to chart for that hour.
- Choose All models. A model filter hides other models’ traffic.
- Read the chart’s message. The gateway served no requests in this range. means data was expected but none arrived. This gateway is not reporting request latency. means the gateway does not publish that measurement. See Metrics by gateway.
- Check that the gateway’s metrics endpoint responds and reports token usage.
Check the metrics endpoint
Forward the gateway’s metrics port to your machine to read what it publishes. This example uses agentgateway on its default port.curl against the loopback address on the host instead.
Use the port and path for your gateway, and look for its metrics in the output.
If the endpoint does not respond, correct the port in the connection or in the
gateway’s configuration. If it responds without token metrics, send a model
request through the gateway and check again. Each gateway’s guide in
Supported gateways
describes the settings that publish its metrics.